Edit chart
Loading graph
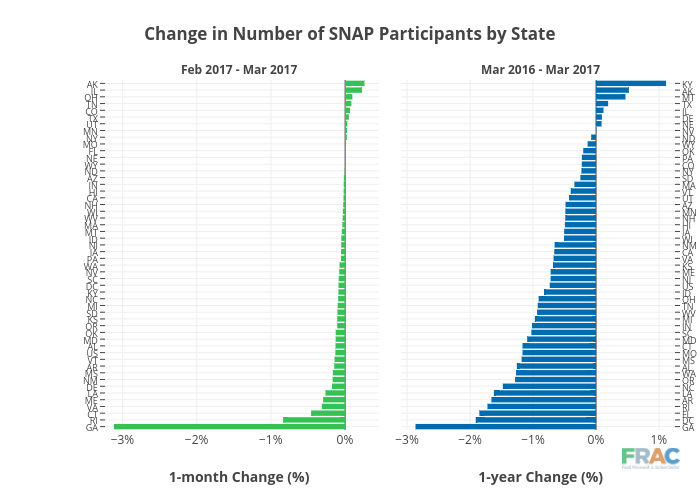
Cbsutton's interactive graph and data of "Change in Number of SNAP Participants by State" is a bar chart; with 1-month Change (%) in the x-axis. The x-axis shows values from -3.3042696061153043 to 0.448738938528976. The y-axis shows values from -0.5 to 51.5. This visualization has the following annotations: Feb 2017 - Mar 2017; Mar 2016 - Mar 2017