Edit chart
Loading graph
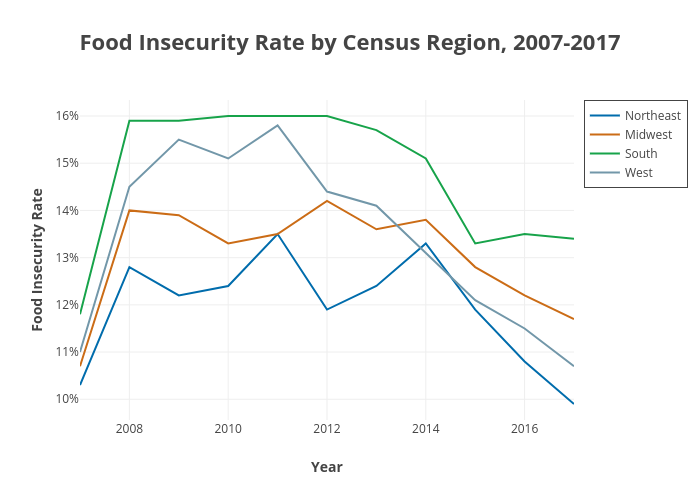
Cbsutton's interactive graph and data of "Food Insecurity Rate by Census Region, 2007-2017" is a line chart, showing Northeast, Midwest, South, West; with Year in the x-axis and Food Insecurity Rate in the y-axis.. The x-axis shows values from 2007 to 2017. The y-axis shows values from 9.561111111111112 to 16.33888888888889.