Edit chart
Loading graph
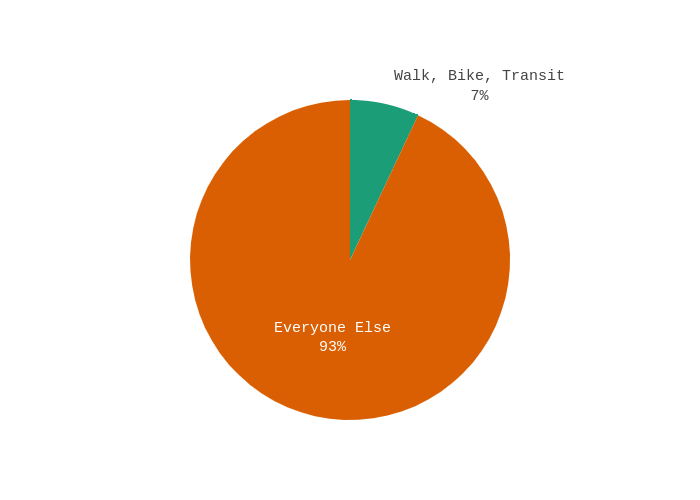
Charlie2343's interactive graph and data is a pie. The x-axis shows values from -1 to 6. The y-axis shows values from -1 to 4.