Edit chart
Loading graph
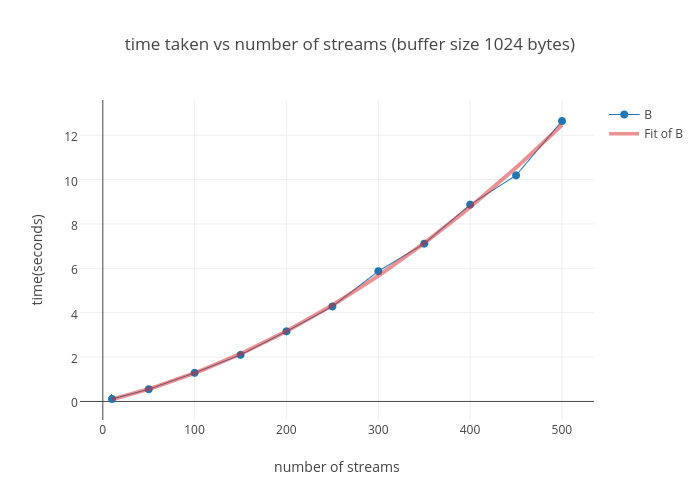
Ckousik's interactive graph and data of "time taken vs number of streams (buffer size 1024 bytes)" is a line chart, showing B; with number of streams in the x-axis and time(seconds) in the y-axis.. The x-axis shows values from -21.017847183491355 to 531.0178471834913. The y-axis shows values from -0.7946524865188739 to 13.544652486518874.