Edit chart
Loading graph
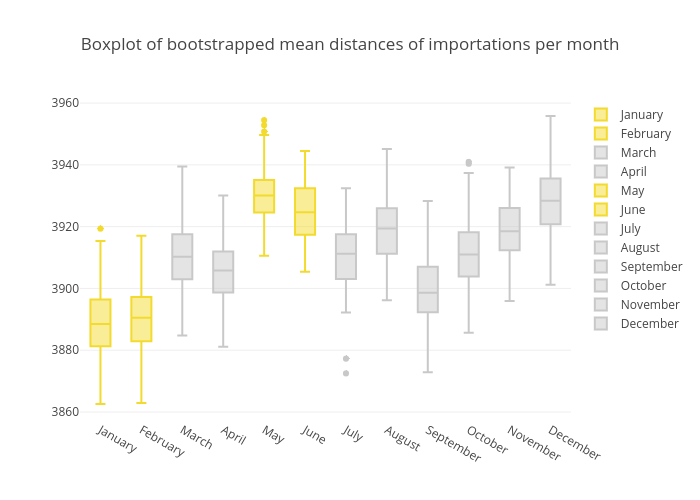
Claranguyen's interactive graph and data of "Boxplot of bootstrapped mean distances of importations per month" is a box plot, showing January, February, March, April, May, June, July, August, September, October, November, December. The x-axis shows values from 0 to 0. The y-axis shows values from 0 to 0.