Edit chart
Loading graph
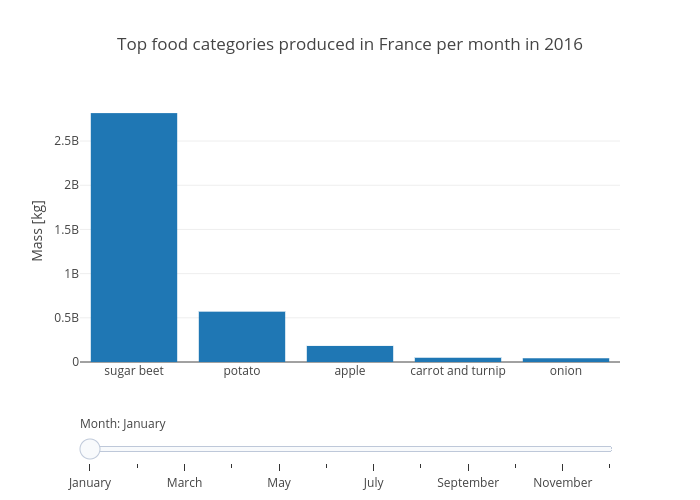
Claranguyen's interactive graph and data of "Top food categories produced in France per month in 2016" is a bar chart; with Mass [kg] in the y-axis. The x-axis shows values from 0 to 0. The y-axis shows values from 0 to 0.