Edit chart
Loading graph
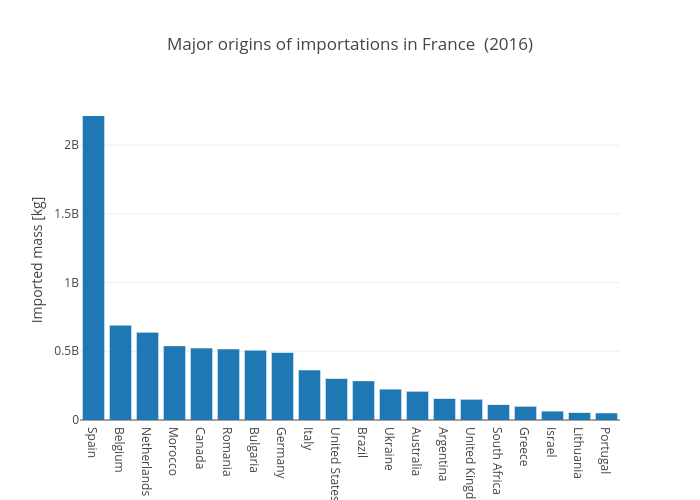
Claranguyen's interactive graph and data of "Major origins of importations in France (2016)" is a bar chart; with Imported mass [kg] in the y-axis. The x-axis shows values from -0.5 to 19.5. The y-axis shows values from 0 to 2327719808.4210525.