Edit chart
Loading graph
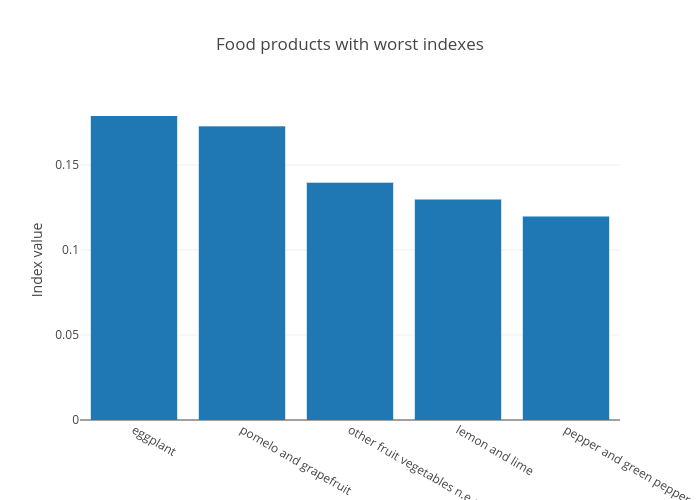
Claranguyen's interactive graph and data of "Food products with worst indexes" is a bar chart; with Index value in the y-axis. The x-axis shows values from 0 to 0. The y-axis shows values from 0 to 0.