Edit chart
Loading graph
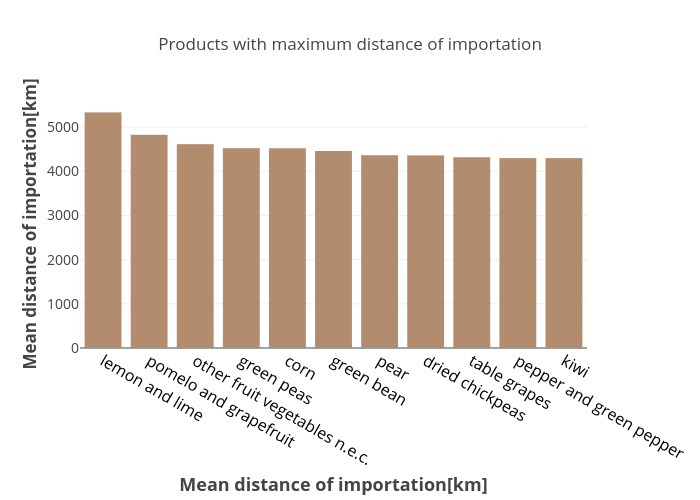
Claranguyen's interactive graph and data of "Products with maximum distance of importation" is a bar chart; with Mean distance of importation[km] in the x-axis and Mean distance of importation[km] in the y-axis.. The x-axis shows values from -0.5 to 10.5. The y-axis shows values from 0 to 5611.258988684603.