Edit chart
Loading graph
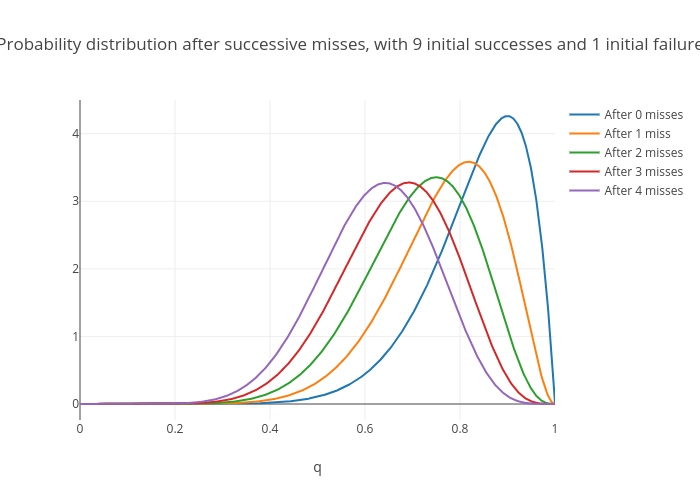
Conk0044's interactive graph and data of "Probability distribution after successive misses, with 9 initial successes and 1 initial failure" is a scatter chart, showing After 0 misses, After 1 miss, After 2 misses, After 3 misses, After 4 misses; with q in the x-axis. The x-axis shows values from 0 to 0. The y-axis shows values from 0 to 0.