Edit chart
Loading graph
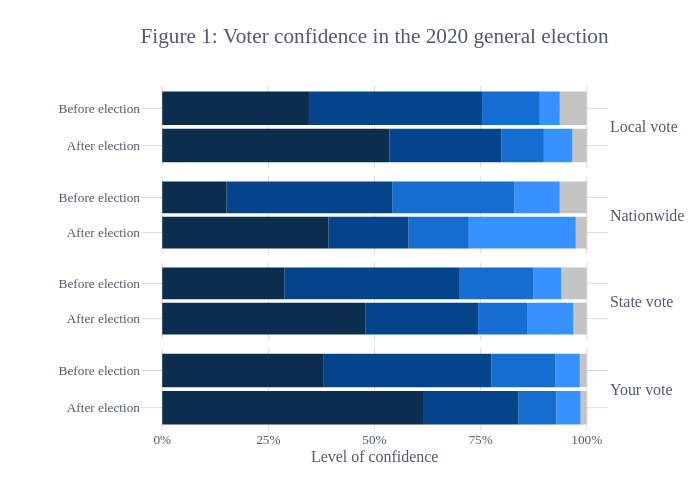
Declanc's interactive graph and data of "Figure 1: Voter confidence in the 2020 general election" is a , showing Don't know, Don't know, Don't know, Don't know, Not at all confident, Not at all confident, Not at all confident, Not at all confident, Not too confident, Not too confident, Not too confident, Not too confident, Somewhat confident, Somewhat confident, Somewhat confident, Somewhat confident, Very confident, Very confident, Very confident, Very confident. The x-axis shows values from -0.0500000016 to 1.0500000336. The y-axis shows values from 0.4 to 2.6. This visualization has the following annotations: Level of confidence; Local vote; Nationwide; State vote; Your vote