Edit chart
Loading graph
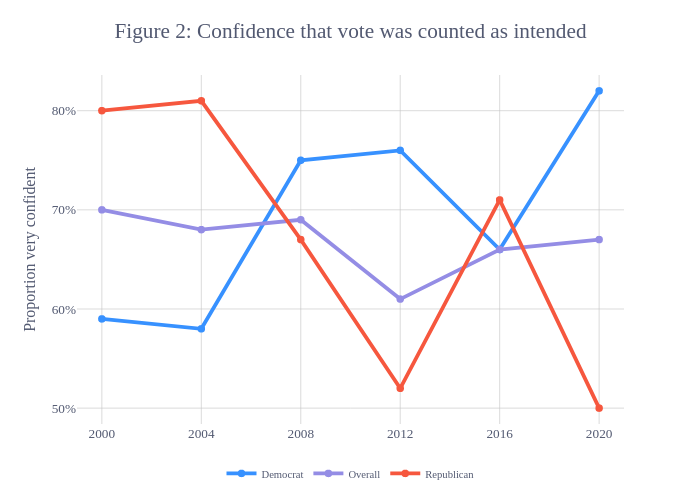
Declanc's interactive graph and data of "Figure 2: Confidence that vote was counted as intended" is a line chart, showing Democrat, Overall, Republican; with Proportion very confident in the y-axis. The x-axis shows values from 1999 to 2021. The y-axis shows values from 0.484 to 0.836.