Edit chart
Loading graph
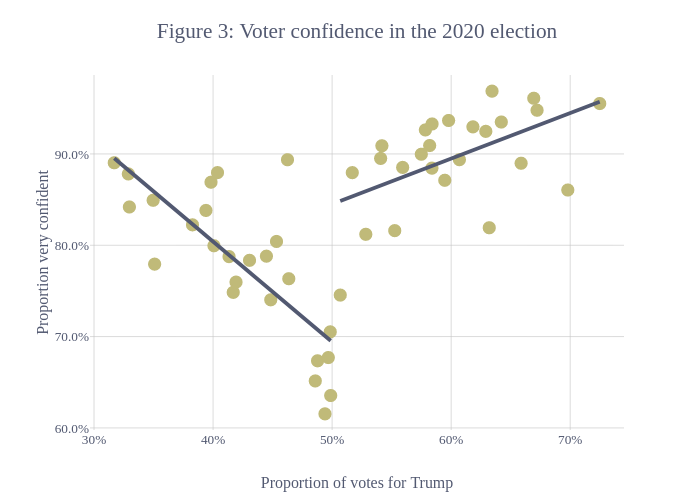
Declanc's interactive graph and data of "Figure 3: Voter confidence in the 2020 election" is a scatter chart, showing fitted values vs fitted values; with Proportion of votes for Trump in the x-axis and Proportion very confident in the y-axis.. The x-axis shows values from 0.296618321 to 0.745194119. The y-axis shows values from 0.597713593 to 0.986451327.