Edit chart
Loading graph
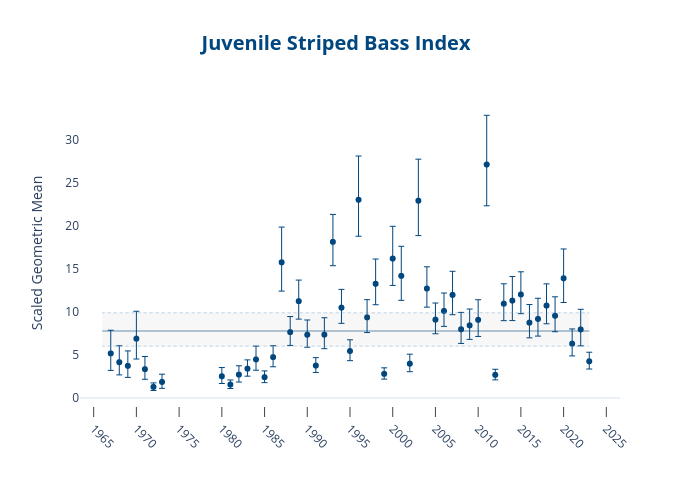
Dlmalm's interactive graph and data of "Juvenile Striped Bass Index" is a scatter chartwith vertical error bars, showing SBSS Index; with in the x-axis and Scaled Geometric Mean in the y-axis.. The x-axis shows values from 1963.734445326979 to 2026.265554673021. The y-axis shows values from -0.903888888888889 to 34.57388888888889.