Edit chart
Loading graph
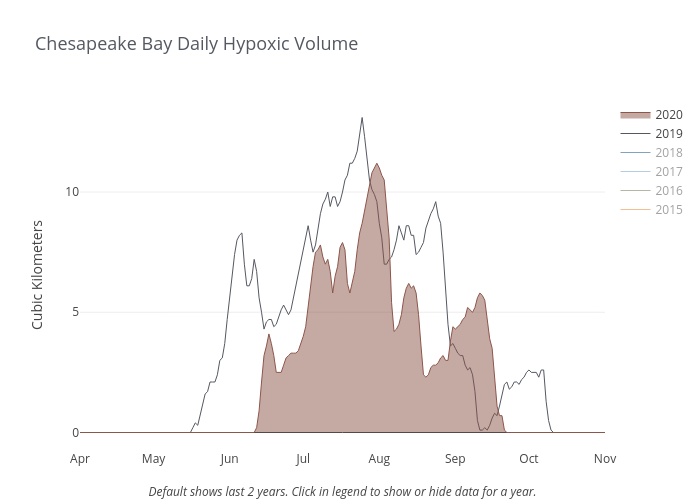
Dlmalm's interactive graph and data of "Chesapeake Bay Daily Hypoxic Volume" is a line chart, showing 2015, 2016, 2017, 2018, 2019, 2020; with Default shows last 2 years. Click in legend to show or hide data for a year. in the x-axis and Cubic Kilometers in the y-axis.. The x-axis shows values from 2014-04-01 to 2014-11-01. The y-axis shows values from -0.7277777777777777 to 13.827777777777778.