Edit chart
Loading graph
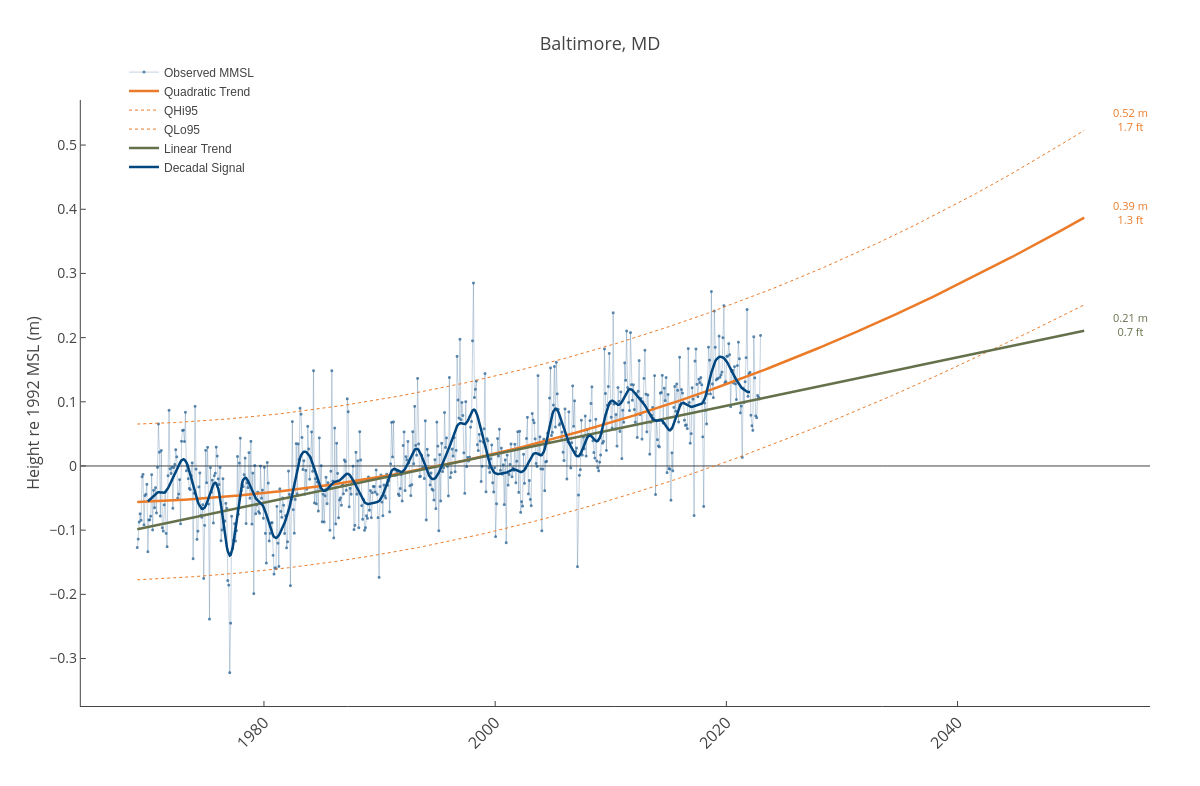
Dlmalm's interactive graph and data of "Baltimore, MD" is a line chart, showing Observed MMSL, Quadratic Trend, QHi95, QLo95, Linear Trend, Decadal Signal; with in the x-axis and Height re 1992 MSL (m) in the y-axis.. The x-axis shows values from 1964-02-27 03:15:31.2525 to 2056-08-23 17:01:00.1377. The y-axis shows values from -0.3739948257743363 to 0.5702155171460177. This visualization has the following annotations: 0.39 m1.3 ft; 0.21 m0.7 ft; 0.52 m1.7 ft