Edit chart
Loading graph
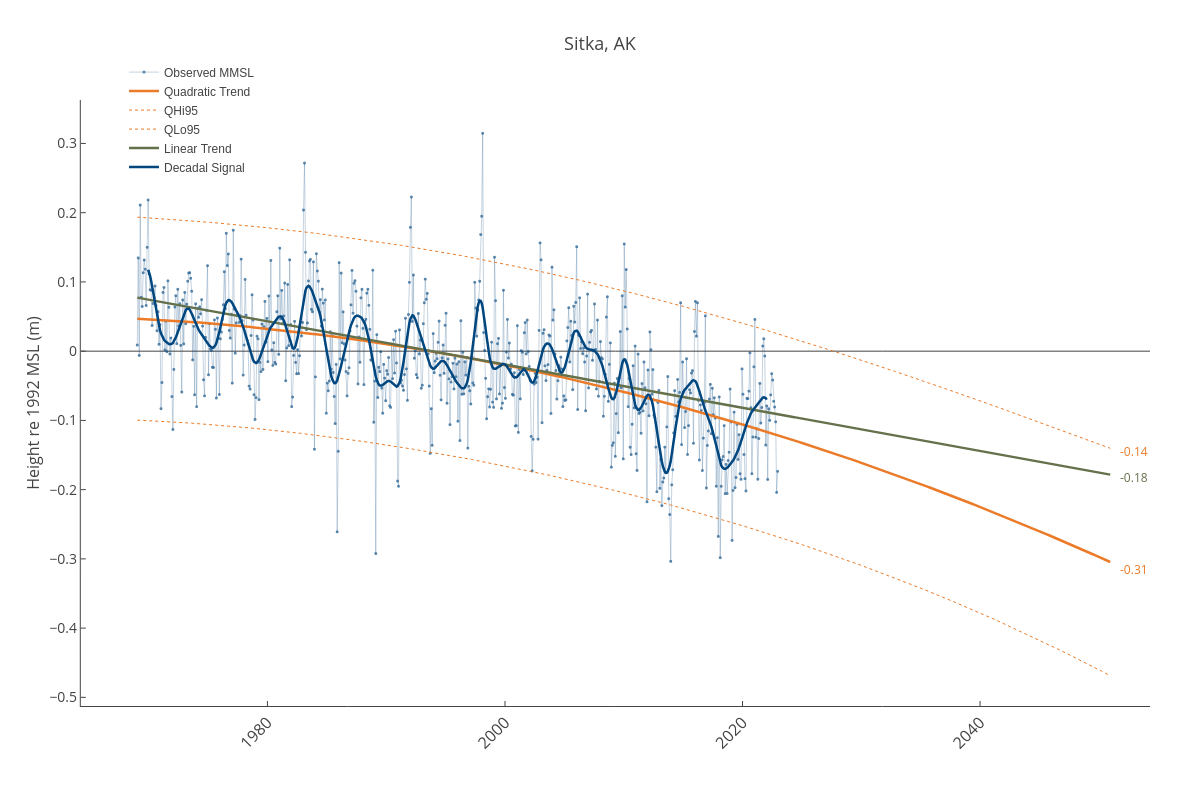
Dlmalm's interactive graph and data of "Sitka, AK" is a line chart, showing Observed MMSL, Quadratic Trend, QHi95, QLo95, Linear Trend, Decadal Signal; with in the x-axis and Height re 1992 MSL (m) in the y-axis.. The x-axis shows values from 1964-04-14 18:00:28.2172 to 2054-04-22 15:10:53.0521. The y-axis shows values from -0.5125029424778761 to 0.362755907079646. This visualization has the following annotations: -0.31; -0.18; -0.14