Edit chart
Loading graph
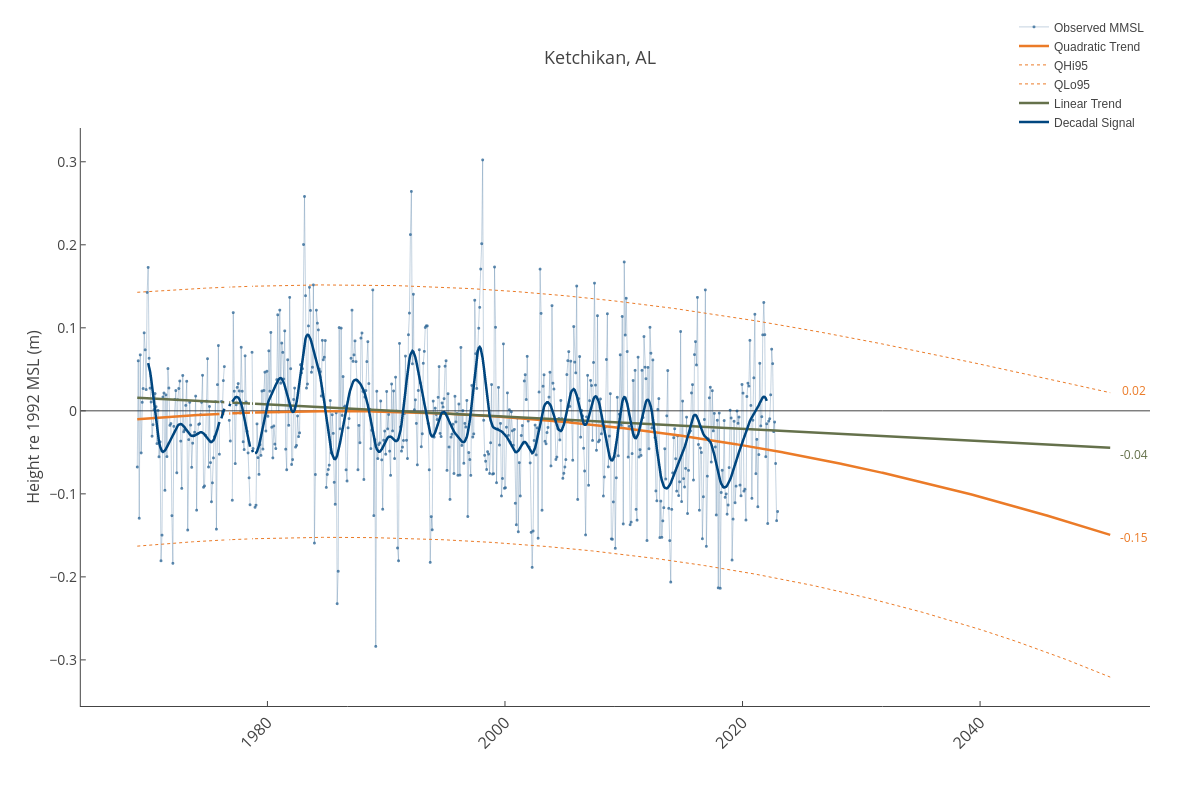
Dlmalm's interactive graph and data of "Ketchikan, AL" is a line chart, showing Observed MMSL, Quadratic Trend, QHi95, QLo95, Linear Trend, Decadal Signal; with in the x-axis and Height re 1992 MSL (m) in the y-axis.. The x-axis shows values from 1964-04-14 18:00:28.2172 to 2054-04-22 15:10:53.0521. The y-axis shows values from -0.3555524303944316 to 0.3406961774941995. This visualization has the following annotations: -0.15; -0.04; 0.02