Edit chart
Loading graph
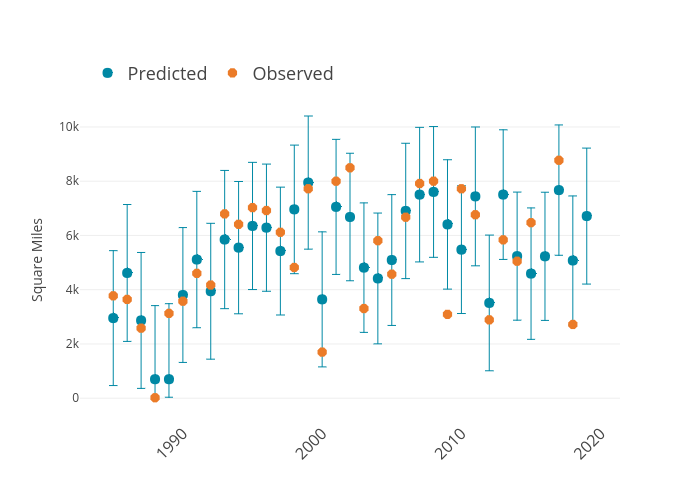
Dlmalm's interactive graph and data of "Square Miles vs " is a scatter chartwith vertical error bars, showing Predicted vs Observed; with in the x-axis and Square Miles in the y-axis.. The x-axis shows values from 1982.9159295693148 to 2021.0840704306852. The y-axis shows values from -674.3439362314076 to 10987.102312433233.