Edit chart
Loading graph
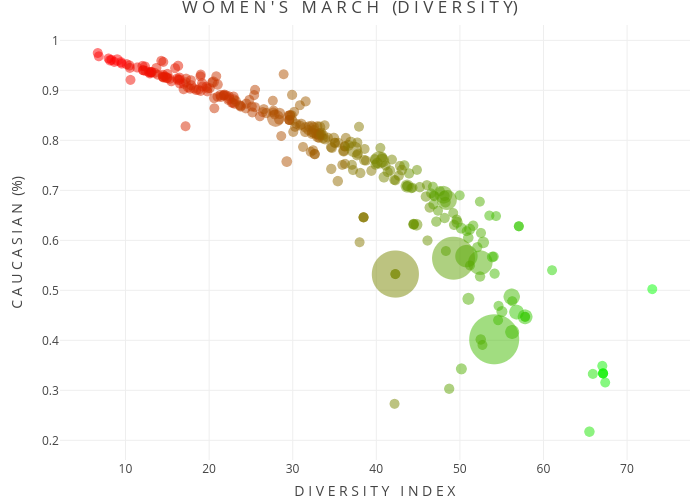
Dnewcomb's interactive graph and data of "W O M E N ' S M A R C H (D I V E R S I T Y)" is a scatter chart, showing []; with D I V E R S I T Y I N D E X in the x-axis and C A U C A S I A N (%) in the y-axis.. The x-axis shows values from 0 to 0. The y-axis shows values from 0 to 0.