Edit chart
Loading graph
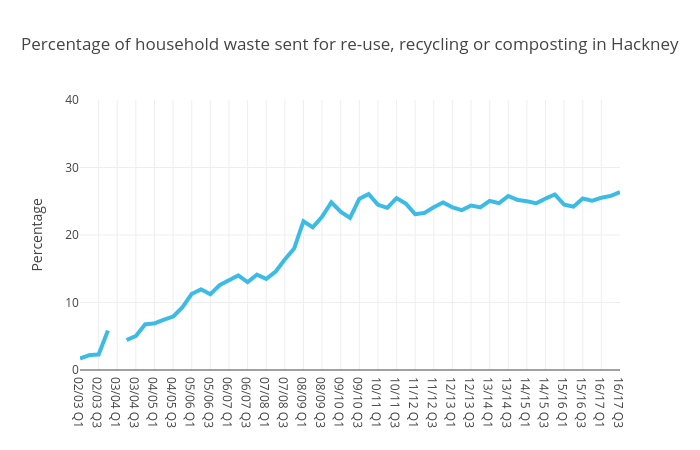
Elinwibe's interactive graph and data of "Percentage of household waste sent for re-use, recycling or composting in Hackney" is a line chart, showing B; with Percentage in the y-axis. The x-axis shows values from 0 to 58. The y-axis shows values from 0 to 40.