Edit chart
Loading graph
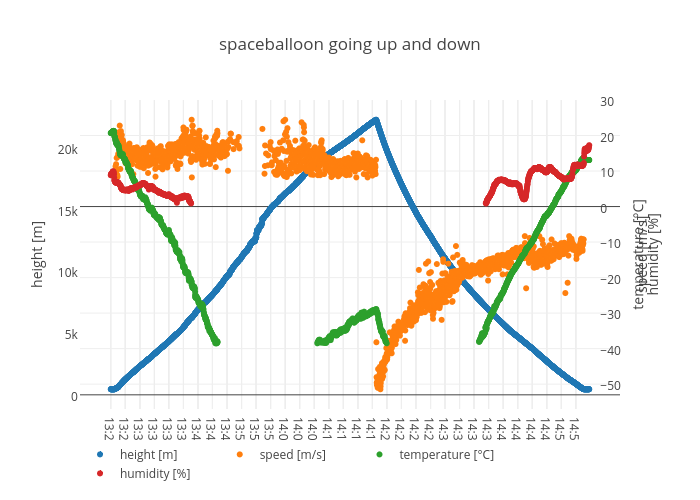
Excogitation's interactive graph and data of "spaceballoon going up and down" is a scatter chart, showing height [m], speed [m/s], temperature [°C], humidity [%]; with time in the x-axis and height [m] in the y-axis.. The x-axis shows values from -147.04584394535775 to 2649.045843945358. The y-axis shows values from -968.8304794520544 to 23698.33047945205.