Edit chart
Loading graph
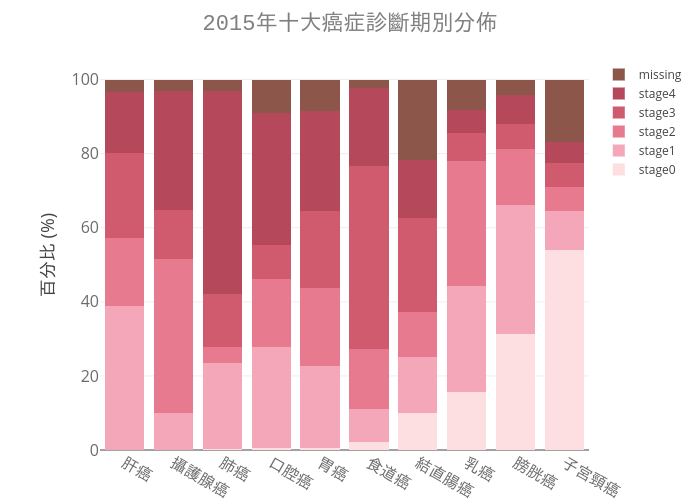
Expedition's interactive graph and data of "2015年十大癌症診斷期別分佈" is a stacked bar chart, showing stage0, stage1, stage2, stage3, stage4, missing; with {'font': {'size': 16, 'color': 'rgb(107, 107, 107)'}} in the x-axis and 百分比 (%) in the y-axis.. The x-axis shows values from 0 to 0. The y-axis shows values from 0 to 0.