Edit chart
Loading graph
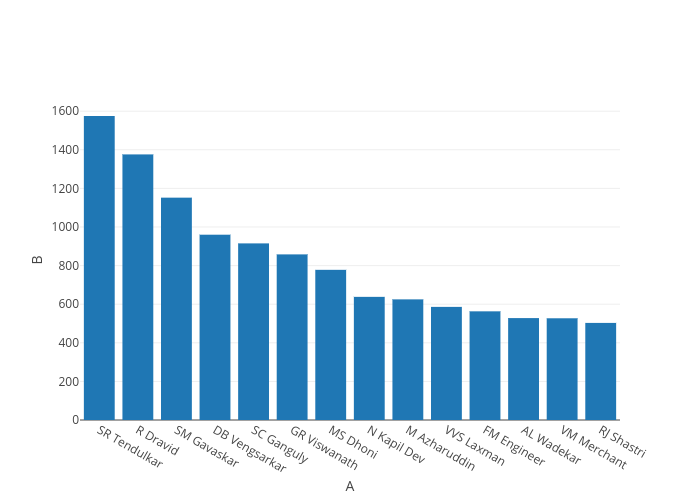
Fandefee's interactive graph and data of "B vs A" is a bar chart, showing B; with A in the x-axis and B in the y-axis.. The x-axis shows values from -0.5 to 13.5. The y-axis shows values from 0 to 1657.8947368421052.