Edit chart
Loading graph
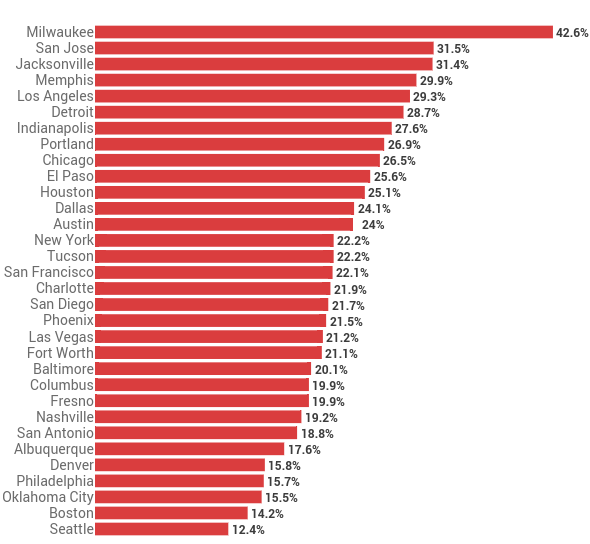
Governing's interactive graph and data of "A" is a bar chart, showing A. The x-axis shows values from 0 to 44. The y-axis shows values from -0.559118236472946 to 31.559118236472948. This visualization has the following annotations: 12.4%; 42.6%; 31.5%; 31.4%; 29.9%; 29.3%; 28.7%; 27.6%; 26.9%; 26.5%; 25.6%; 25.1%; 24.1%; 24%; 22.2%; 22.2%; 22.1%; 21.9%; 21.7%; 21.5%; 21.2%; 21.1%; 20.1%; 19.9%; 19.9%; 19.2%; 18.8%; 17.6%; 15.8%; 15.7%; 15.5%; 14.2%