Edit chart
Loading graph
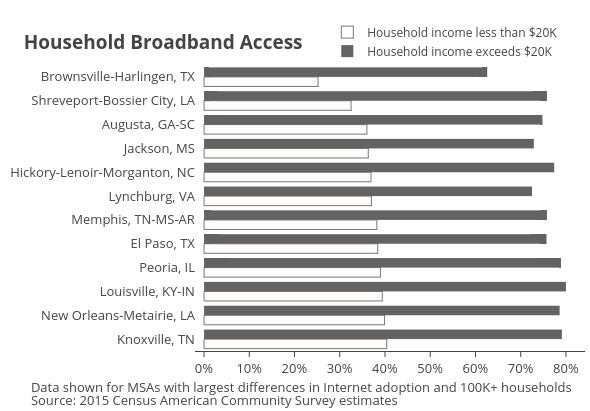
Governing's interactive graph and data of "Household income less than $20K vs Household income exceeds $20K" is a bar chart, showing Household income less than $20K vs Household income exceeds $20K. The x-axis shows values from -2 to 84.21052631578948. The y-axis shows values from -0.5 to 11.5. This visualization has the following annotations: Household Broadband Access; Data shown for MSAs with largest differences in Internet adoption and 100K+ households; Source: 2015 Census American Community Survey estimates