Edit chart
Loading graph
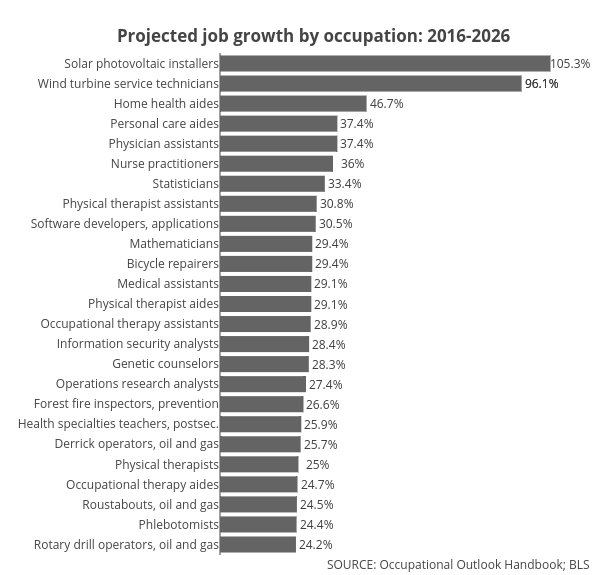
Governing's interactive graph and data of "A" is a bar chart, showing A. The x-axis shows values from 0 to 118.84084720121028. The y-axis shows values from -0.523908523908524 to 24.523908523908524. This visualization has the following annotations: Projected job growth by occupation: 2016-2026; SOURCE: Occupational Outlook Handbook; BLS; 24.2%; 24.4%; 24.5%; 24.7%; 25%; 25.7%; 25.9%; 26.6%; 27.4%; 28.3%; 28.4%; 28.9%; 29.1%; 29.1%; 29.4%; 29.4%; 30.5%; 30.8%; 33.4%; 36%; 37.4%; 37.4%; 46.7%; 105.3%; 96.1%; 96.1%