Edit chart
Loading graph
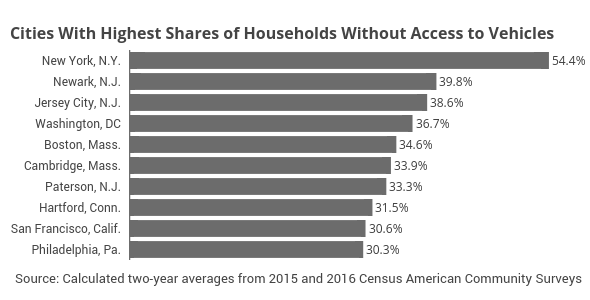
Governing's interactive graph and data of "A" is a bar chart, showing A. The x-axis shows values from -1 to 57.26315789473684. The y-axis shows values from -0.5 to 9.5. This visualization has the following annotations: Cities With Highest Shares of Households Without Access to Vehicles; Source: Calculated two-year averages from 2015 and 2016 Census American Community Surveys; 54.4%; 39.8%; 38.6%; 36.7%; 34.6%; 33.9%; 33.3%; 31.5%; 30.6%; 30.3%