Edit chart
Loading graph
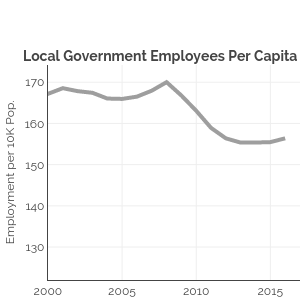
Governing's interactive graph and data of "B" is a line chart, showing B; with Employment per 10K Pop. in the y-axis. The x-axis shows values from 2000 to 2017. The y-axis shows values from 122 to 174.18692438888888. This visualization has the following annotation: Local Government Employees Per Capita