Edit chart
Loading graph
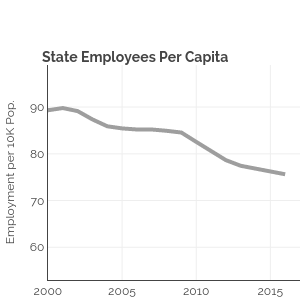
Governing's interactive graph and data of "C" is a line chart, showing C; with Employment per 10K Pop. in the y-axis. The x-axis shows values from 2000 to 2017. The y-axis shows values from 53 to 99. This visualization has the following annotations: State Employees Per Capita; Full-time equivalent jobs shown exclude education.