Edit chart
Loading graph
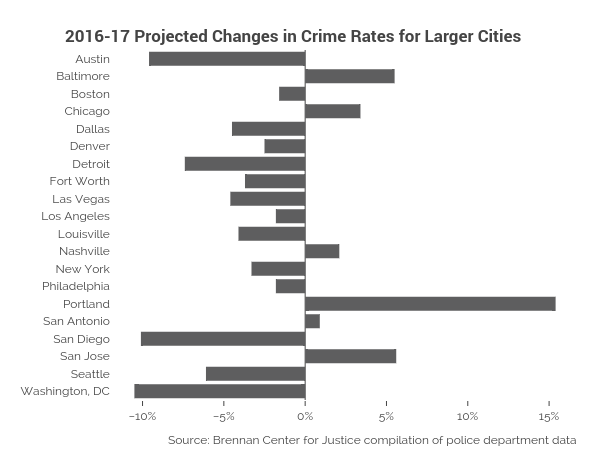
Governing's interactive graph and data of "D" is a bar chart, showing D. The x-axis shows values from -11.938888888888888 to 16.83888888888889. The y-axis shows values from -0.5 to 19.5. This visualization has the following annotations: 2016-17 Projected Changes in Crime Rates for Larger Cities; Source: Brennan Center for Justice compilation of police department data