Edit chart
Loading graph
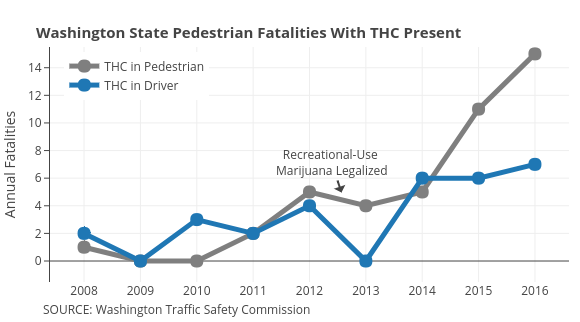
Governing's interactive graph and data of "THC in Pedestrian vs THC in Driver" is a line chart, showing THC in Pedestrian vs THC in Driver; with Annual Fatalities in the y-axis. The x-axis shows values from 2007.3953643118555 to 2016.6046356881445. The y-axis shows values from -1.5205531590966759 to 15.5. This visualization has the following annotations: Washington State Pedestrian Fatalities With THC Present; SOURCE: Washington Traffic Safety Commission; Recreational-Use Marijuana Legalized