Edit chart
Loading graph
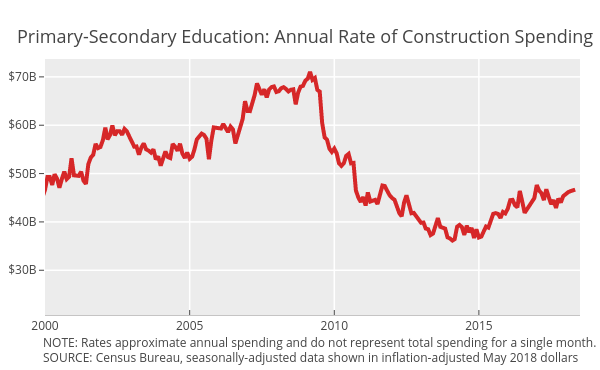
Governing's interactive graph and data of "Primary/Secondary School" is a scatter chart, showing Primary/Secondary School; with time in the x-axis. The x-axis shows values from 2000-01-01 to 2018-07-01. The y-axis shows values from 20743054015.833332 to 73698828539.16667. This visualization has the following annotations: SOURCE: Census Bureau, seasonally-adjusted data shown in inflation-adjusted May 2018 dollars; Primary-Secondary Education: Annual Rate of Construction Spending; NOTE: Rates approximate annual spending and do not represent total spending for a single month.