Edit chart
Loading graph
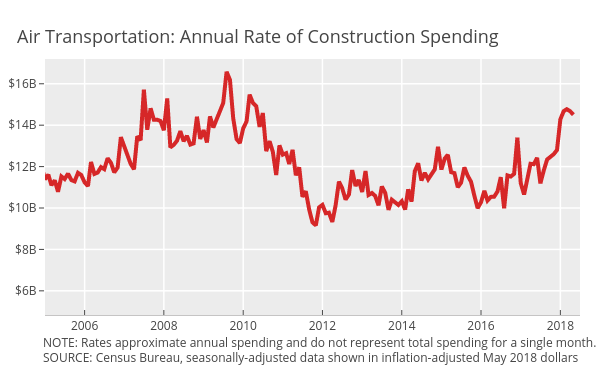
Governing's interactive graph and data of "Air Transportation" is a scatter chart, showing Air Transportation; with time in the x-axis. The x-axis shows values from 2005-01-01 to 2018-07-01. The y-axis shows values from 4832492333.944445 to 17196085675.055557. This visualization has the following annotations: SOURCE: Census Bureau, seasonally-adjusted data shown in inflation-adjusted May 2018 dollars; Air Transportation: Annual Rate of Construction Spending; NOTE: Rates approximate annual spending and do not represent total spending for a single month.