Edit chart
Loading graph
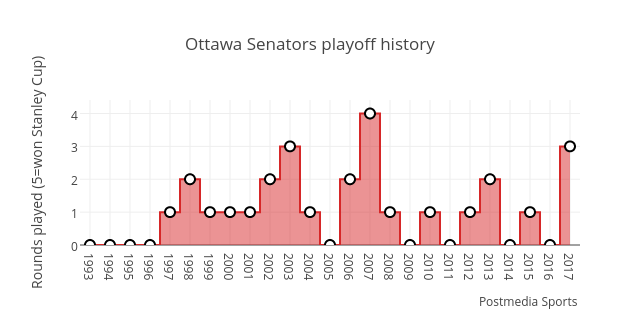
Grspur's interactive graph and data of "Ottawa Senators playoff history" is a filled line chart, showing Rounds played (5=won Stanley Cup); with Rounds played (5=won Stanley Cup) in the y-axis. The x-axis shows values from 1992.5 to 2017.5. The y-axis shows values from 0 to 4.4106463878327. This visualization has the following annotation: Postmedia Sports