Edit chart
Loading graph
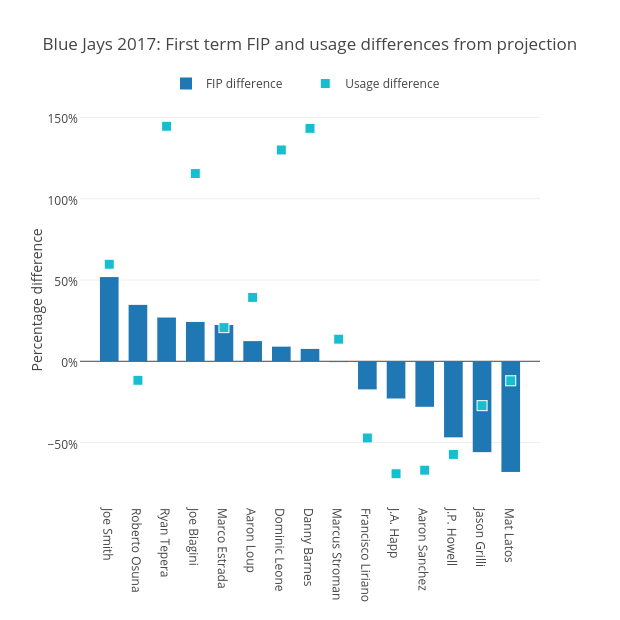
Grspur's interactive graph and data of "Blue Jays 2017: First term FIP and usage differences from projection" is a bar chart, showing FIP difference vs Usage difference; with Percentage difference in the y-axis. The x-axis shows values from -1.0199252801992529 to 15.019925280199253. The y-axis shows values from -85.35035971223022 to 160.75035971223022.