Edit chart
Loading graph
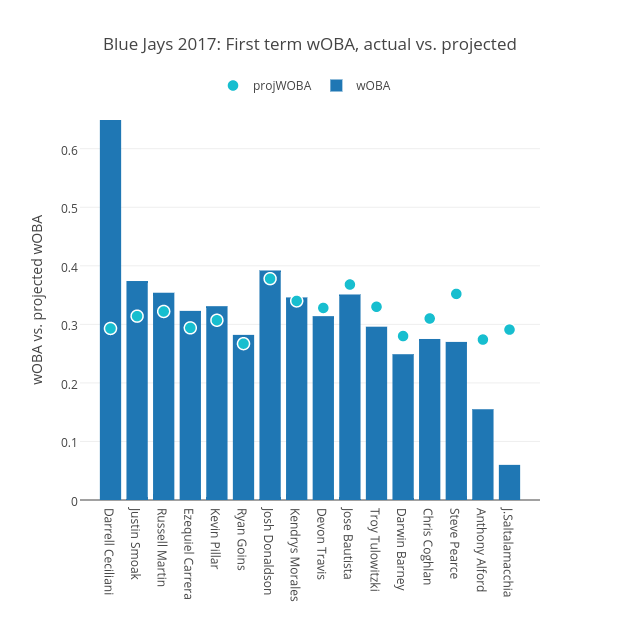
Grspur's interactive graph and data of "Blue Jays 2017: First term wOBA, actual vs. projected" is a bar chart, showing wOBA vs projWOBA; with wOBA vs. projected wOBA in the y-axis. The x-axis shows values from -1.1466165413533833 to 16.14661654135338. The y-axis shows values from 0 to 0.6831578947368422.