Edit chart
Loading graph
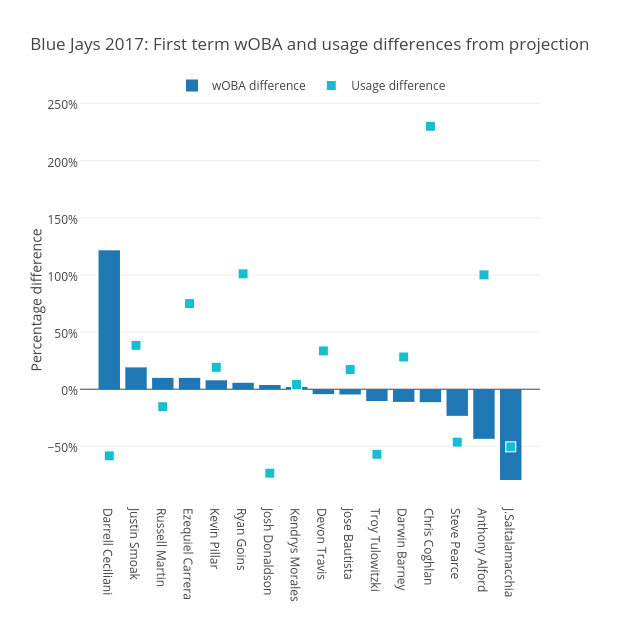
Grspur's interactive graph and data of "Blue Jays 2017: First term wOBA and usage differences from projection" is a bar chart, showing wOBA difference vs Usage difference; with Percentage difference in the y-axis. The x-axis shows values from -1.0927770859277708 to 16.09277708592777. The y-axis shows values from -96.89257950530036 to 252.9590106007067.