Edit chart
Loading graph
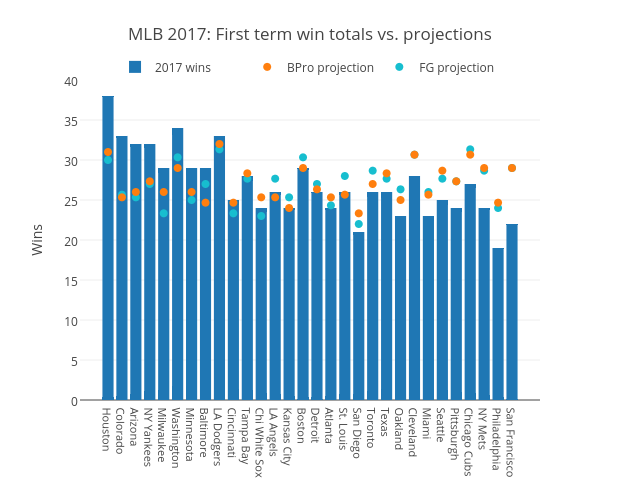
Grspur's interactive graph and data of "MLB 2017: First term win totals vs. projections" is a scatter chart, showing FG projection, BPro projection, 2017 wins; with Wins in the y-axis. The x-axis shows values from -2.00990099009901 to 31.00990099009901. The y-axis shows values from 0 to 40.