Edit chart
Loading graph
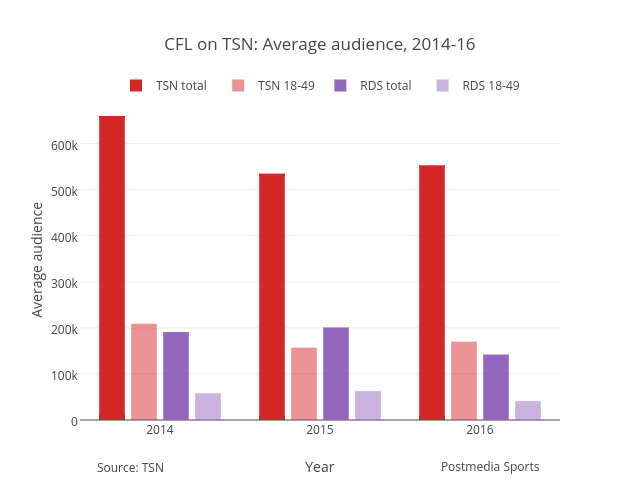
Grspur's interactive graph and data of "CFL on TSN: Average audience, 2014-16" is a bar chart, showing TSN total, TSN 18-49, RDS total, RDS 18-49; with Year in the x-axis and Average audience in the y-axis.. The x-axis shows values from 2013.5 to 2016.5. The y-axis shows values from 0 to 694736.8421052631. This visualization has the following annotations: Source: TSN; Postmedia Sports