Edit chart
Loading graph
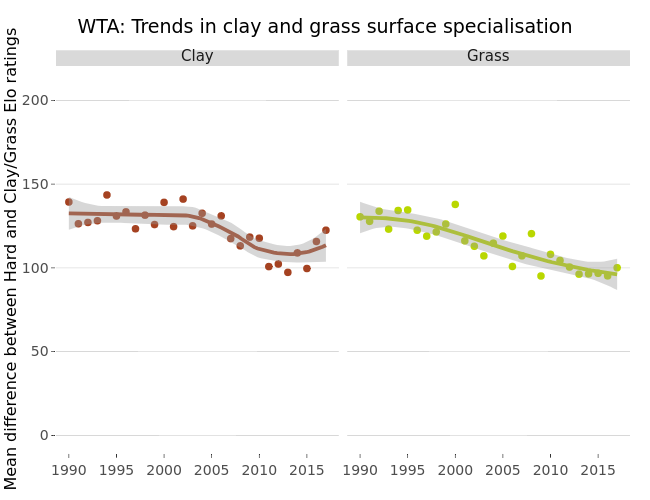
Gtspence's interactive graph and data of "WTA: Trends in clay and grass surface specialisation" is a scatter chart, showing Clay, Grass, Clay, Grass, Clay, Grass. The x-axis shows values from 1988.65 to 2018.35. The y-axis shows values from -10.5 to 220.5. This visualization has the following annotations: Mean difference between Hard and Clay/Grass Elo ratings; Clay; Grass