Edit chart
Loading graph
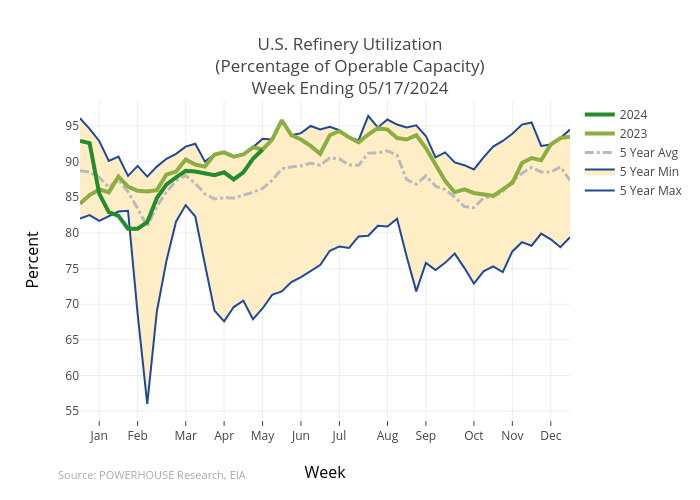
Gumatt's interactive graph and data of "U.S. Refinery Utilization(Percentage of Operable Capacity)Week Ending 04/26/2024" is a scatter chart, showing 5 Year Max, 5 Year Min, 5 Year Avg, 2023, 2024; with Week in the x-axis and Percent in the y-axis.. The x-axis shows values from 0 to 0. The y-axis shows values from 0 to 0. This visualization has the following annotation: Source: POWERHOUSE Research, EIA