Edit chart
Loading graph
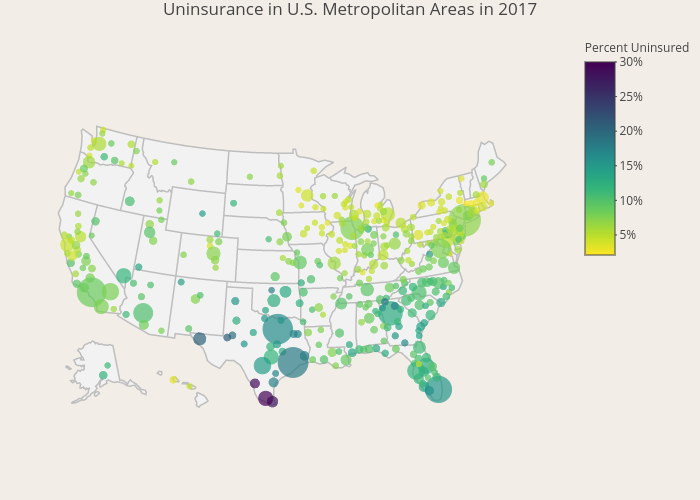
Hestx005's interactive graph and data of "Uninsurance in U.S. Metropolitan Areas in 2017" is a scattergeo. The x-axis shows values from 0 to 0. The y-axis shows values from 0 to 0.