Edit chart
Loading graph
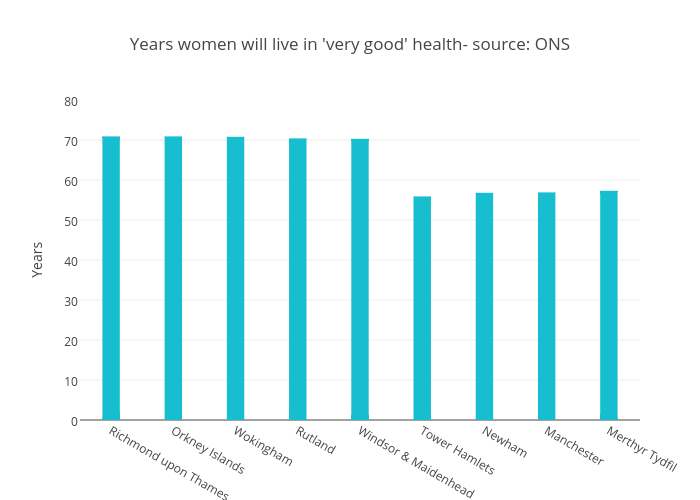
Isabellefclark's interactive graph and data of "Years women will live in 'very good' health- source: ONS" is a bar chart, showing A; with Years in the y-axis. The x-axis shows values from -0.5 to 8.5. The y-axis shows values from 0 to 80.