Edit chart
Loading graph
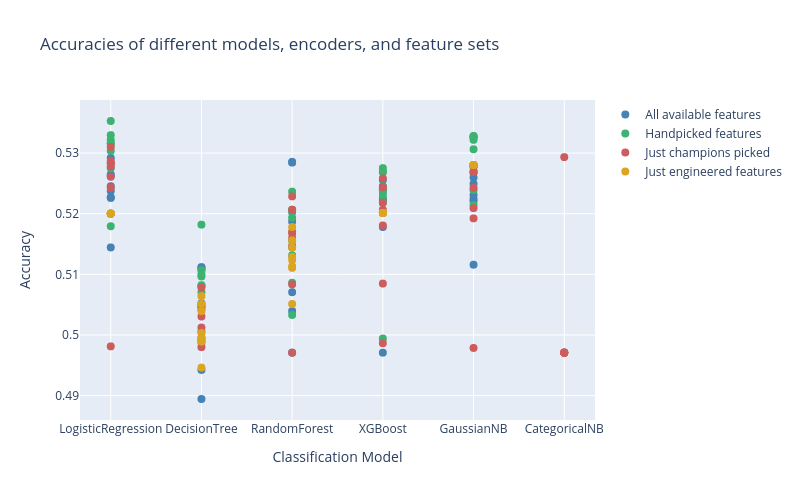
Jduke9's interactive graph and data of "Accuracies of different models, encoders, and feature sets" is a scatter chart, showing All available features, All available features, All available features, All available features, All available features, All available features, Handpicked features, Handpicked features, Handpicked features, Handpicked features, Handpicked features, Handpicked features, Just champions picked, Just champions picked, Just champions picked, Just champions picked, Just champions picked, Just champions picked, Just engineered features, Just engineered features, Just engineered features, Just engineered features, Just engineered features, Just engineered features; with Classification Model in the x-axis and Accuracy in the y-axis.. The x-axis shows values from 0 to 0. The y-axis shows values from 0 to 0.