Edit chart
Loading graph
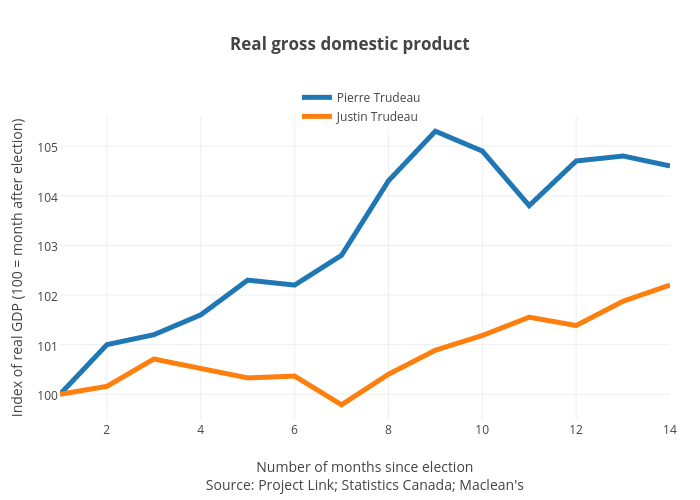
Jasonkirby's interactive graph and data of "Real gross domestic product" is a line chart, showing Pierre Trudeau vs Justin Trudeau; with Number of months since electionSource: Project Link; Statistics Canada; Maclean's in the x-axis and Index of real GDP (100 = month after election) in the y-axis.. The x-axis shows values from 1 to 14. The y-axis shows values from 99.48183743777777 to 105.60621908222222.