Edit chart
Loading graph
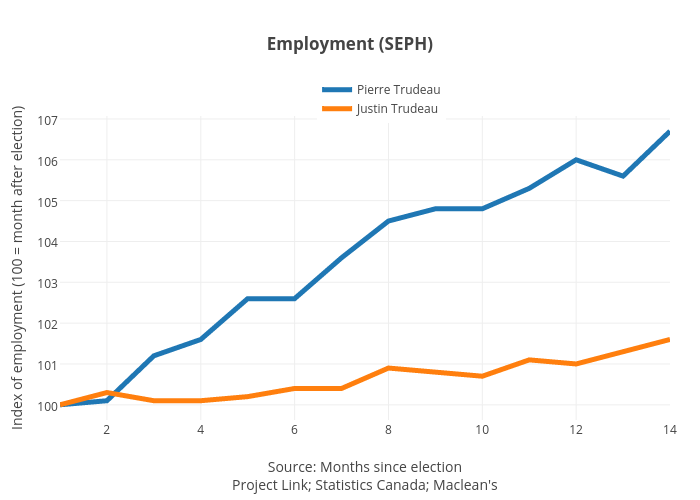
Jasonkirby's interactive graph and data of "Employment (SEPH)" is a line chart, showing Pierre Trudeau vs Justin Trudeau; with Source: Months since electionProject Link; Statistics Canada; Maclean's in the x-axis and Index of employment (100 = month after election) in the y-axis.. The x-axis shows values from 1 to 14. The y-axis shows values from 99.62777777777778 to 107.07222222222222.