Edit chart
Loading graph
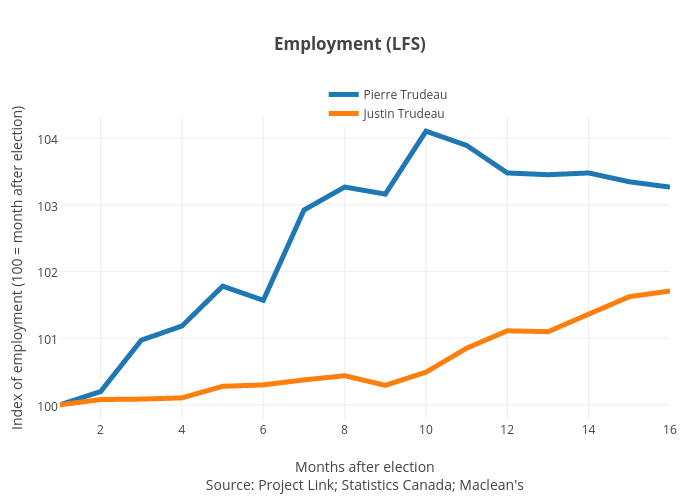
Jasonkirby's interactive graph and data of "Employment (LFS)" is a line chart, showing Pierre Trudeau vs Justin Trudeau; with Months after electionSource: Project Link; Statistics Canada; Maclean's in the x-axis and Index of employment (100 = month after election) in the y-axis.. The x-axis shows values from 1 to 16. The y-axis shows values from 99.77212305555555 to 104.32966194444445.