Edit chart
Loading graph
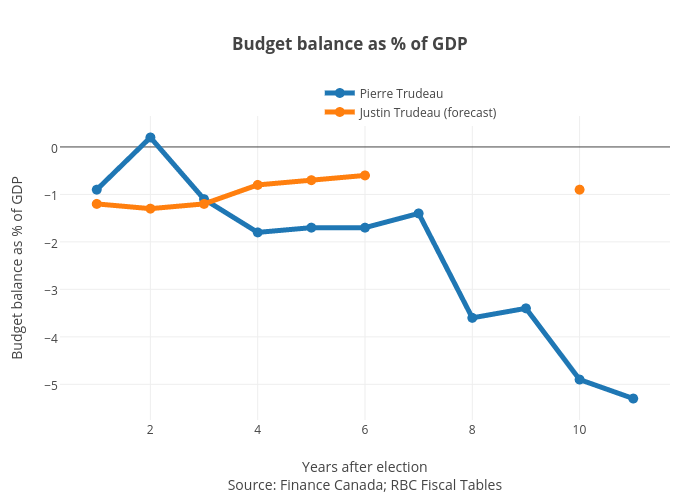
Jasonkirby's interactive graph and data of "Budget balance as % of GDP" is a line chart, showing Pierre Trudeau vs Justin Trudeau (forecast); with Years after electionSource: Finance Canada; RBC Fiscal Tables in the x-axis and Budget balance as % of GDP in the y-axis.. The x-axis shows values from 0.3583384996900185 to 11.641661500309981. The y-axis shows values from -5.727151316417816 to 0.6271513164178155.