Edit chart
Loading graph
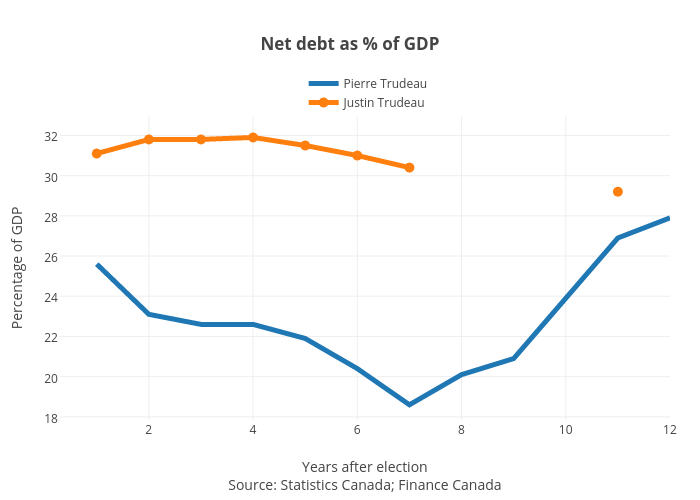
Jasonkirby's interactive graph and data of "Net debt as % of GDP" is a line chart, showing Pierre Trudeau vs Justin Trudeau; with Years after electionSource: Statistics Canada; Finance Canada in the x-axis and Percentage of GDP in the y-axis.. The x-axis shows values from 0.33673172152636177 to 12. The y-axis shows values from 17.84669590460732 to 32.91277781246098.